top of page

Programming is the way a person communicates with computers. Just as mathematics is the language of all sciences, so is programming the language of computer's communication. It is a new and rapidly evolving science as more and more professions nowadays require at least a basic knowledge of computers.
Programming is also a rigorous science in the sense that the code must be perfectly spelled as even a wrong dot or comma is enough to keep the algorithm from running correctly.
Today there is a plethora of programming languages and each one has their own advantages and disadvantages. As a physics researcher, I am familiar with Matlab and Mathematica languages and both of them have been a precious tool for the teaching methods I have developed (all graphs and animations have been created with them).
In order for a person to be able to evolve in this area, it is necessary to understand the rules as memorization has minimal benefit. That is why it is crucial for the teacher to be able to develop ways of learning that, on one hand, stimulate interest, and on the other hand, help to understand the course material for the student. I have been working on this part for the last 10 years or so, having developed methods based on multisensory learning.
Multisensory learning is one of the most effective ways of teaching [1, 2, 3]. More specifically, I create material such that the student perceives and processes information with as many senses as possible.
Below are some examples of how I teach.
Example 1: Creation of a basic calculator | Concerns: Graduate Students
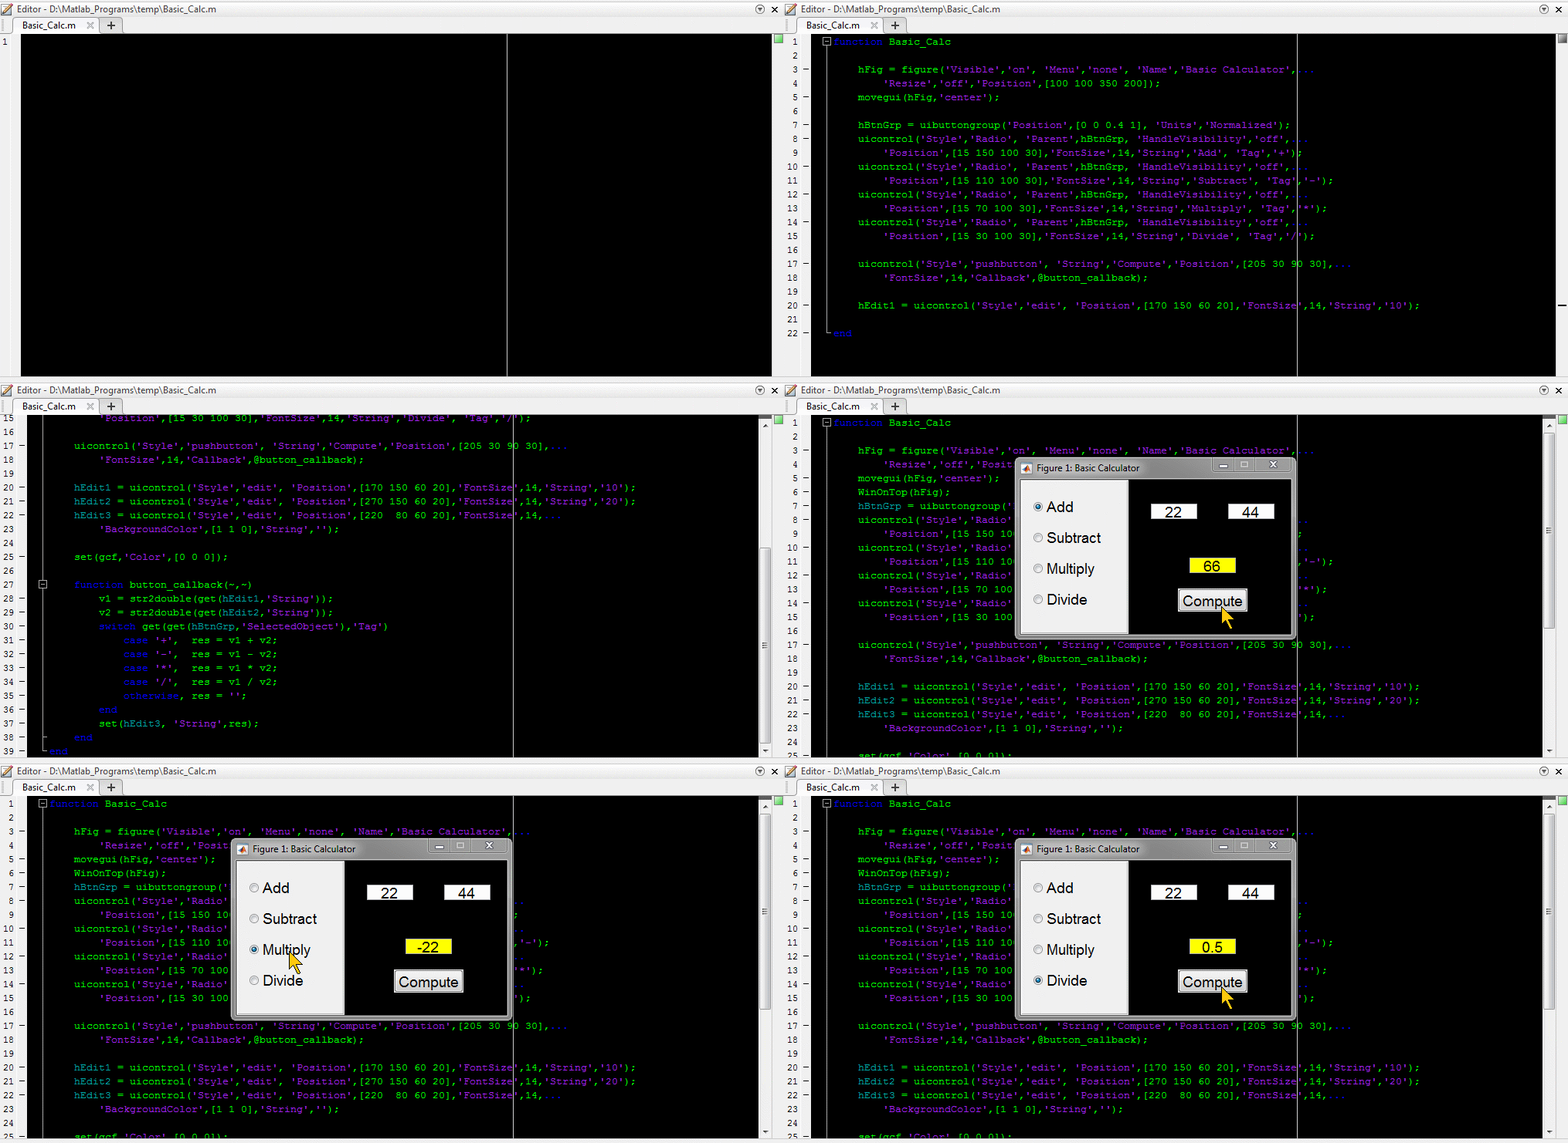
One of the most common exercises for a new programmer is the development of a standard calculator. In this example I am writing a simple program that can add, subtract, multiply and divide 2 values between them.
The student can extend the algorithm by adding additional options such as calculating the square/cube of a number, the angle in degrees/rad, the sine/cosine/tangent of an angle, etc.

Example 2: Designing 3D Graphs | Concerns: Graduate Students
Short code in Matlab, showing how one can draw a 3D graph and add options (buttons) to change both the aesthetics (color) and the graph itself.
The student can modify the algorithm to add three-dimensional equations, define options that dynamically change some variables or parameters, allow the user to change axes range, texture, graph color, etc.

Example 3: Drawing a Graph from a file | Concerns: Graduate Students
Importing numeric data from a file and designing them. The user can select any color of his choice via the RGB color palette, change the thickness of the curve and choose whether the exact points entered from the file will be displayed.
The student can modify the algorithm to ignore the rows of the files without numbers, enter multiple data to compare their graphs, add more options for modifying the axes, etc.

.
bottom of page